) 3K+
3K+
Start Your Learning Journey Today
550+ Students Placed Every Month Be The Next!


Our Hiring Partners
Curriculum Designed By Experts
Expertly designed curriculum for future-ready professionals.
Industry Oriented Curriculum
An exhaustive curriculum designed by our industry experts which will help you to get placed in your dream IT company
-
30+ Case Studies & Projects
-
9+ Engaging Projects
-
10+ Years Of Experience
Tableau Software Training Projects
Become a Tableau Software Expert With Practical and Engaging Projects.
- Practice essential Tools
- Designed by Industry experts
- Get Real-world Experience
Sales Overview Dashboard
Create a simple dashboard displaying total sales, region-wise breakdown, and product performance. Use basic charts like bar, pie, and line graphs. Learn to connect to Excel data and apply filters.
Employee Data Visualization
Visualize employee demographics like age, department, and gender. Work with sorting, grouping, and basic calculated fields. Introduce parameters for department-based filtering.
Product Inventory Tracker
Track product stock levels and reorder points using bar charts. Use conditional formatting to highlight low stock. Learn to join tables and use data blending basics.
Financial Performance Dashboard
Build a dashboard to analyze revenue vs. expenses over time. Apply calculated fields and dual-axis charts. Integrate time filters and trend lines.
Customer Segmentation Analysis
Segment customers based on purchase behavior and geography. Apply clustering, filters, and advanced sorting techniques. Use map visualizations and scatter plots.
Employee Attrition Report
Create an HR dashboard showing attrition rates by tenure and department. Use table calculations for percentages and YOY trends. Incorporate heat maps and KPI indicators.
Executive Sales Dashboard with KPI
Design a multi-sheet dashboard with KPIs, filters, and trend analysis. Integrate complex calculated fields and dynamic titles. Use containers for responsive design.
Forecasting Sales Trends
Apply Tableau’s built-in forecasting models to project sales. Use historical data with date functions and filters. Visualize seasonality and trends using line and area charts.
Multi-Source Data Integration
Combine data from Excel, SQL, and Google Sheets into one dashboard. Use data blending, joins, and unions effectively. Solve common schema mismatches and performance issues.
Career Support


Placement Assistance

Exclusive access to ACTE Job portal

Mock Interview Preparation

1 on 1 Career Mentoring Sessions

Career Oriented Sessions

Resume & LinkedIn Profile Building
Key Features

Practical Training

Global Certifications

Flexible Timing

Trainer Support

Study Material

Placement Support

Mock Interviews

Resume Building
Upcoming Batches
What's included

 Free Aptitude and
Technical Skills Training
Free Aptitude and
Technical Skills Training
- Learn basic maths and logical thinking to solve problems easily.
- Understand simple coding and technical concepts step by step.
- Get ready for exams and interviews with regular practice.

 Hands-On Projects
- Work on real-time projects to apply what you learn.
- Build mini apps and tools daily to enhance your coding skills.
- Gain practical experience just like in real jobs.

 AI Powered Self
Interview Practice Portal
AI Powered Self
Interview Practice Portal
- Practice interview questions with instant AI feedback.
- Improve your answers by speaking and reviewing them.
- Build confidence with real-time mock interview sessions.

 Interview Preparation
For Freshers
Interview Preparation
For Freshers
- Practice company-based interview questions.
- Take online assessment tests to crack interviews
- Practice confidently with real-world interview and project-based questions.
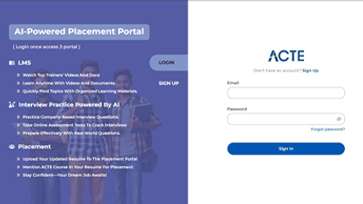
 LMS Online Learning
Platform
LMS Online Learning
Platform
- Explore expert trainer videos and documents to boost your learning.
- Study anytime with on-demand videos and detailed documents.
- Quickly find topics with organized learning materials.
- Learning strategies that are appropriate and tailored to your company's requirements.
- Live projects guided by instructors are a characteristic of the virtual learning environment.
- The curriculum includes of full-day lectures, practical exercises, and case studies.

Tableau Software TrainingOverview
Tableau Software Placement in Bangalore Programmer Potential Career Paths
A Tableau Software Certification in Bangalore programmer can explore various career opportunities in data analytics, business intelligence, and visualization. Common roles include Data Analyst, BI Developer, Data Scientist, and Tableau Consultant. With experience, they can move into senior positions such as Analytics Manager or BI Architect. The demand for data visualization experts is high across industries like finance, healthcare, retail, and IT. Freelancing and consulting opportunities are also growing, offering flexible career options. Continuous learning and Tableau certifications can further accelerate career growth.
What Are the Requirements for a Tableau Software Placement in Bangalore?
- Basic Computer Skills: Learners should be comfortable using spreadsheets, browsers, and general software tools.
- Analytical Mindset: An understanding of data interpretation helps in grasping Tableau's core functionalities faster.
- Knowledge of Excel: Familiarity with Excel functions like pivot tables and charts enhances learning in Tableau.
- Understanding of Databases: Basic knowledge of databases and SQL supports better data handling in Tableau.
- Access to a Computer with Internet: A stable system is necessary to install Tableau and practice with datasets online.
Reasons to Consider Enrolling in Tableau Software Course in Bangalore
Tableau Software Placement in Bangalore provide hands-on experience with real-world datasets, making candidates job-ready. Bangalore is a major tech hub, offering abundant job opportunities for Tableau professionals. Training centers often have tie-ups with leading MNCs and startups for placement support. The curriculum is industry-aligned, ensuring job-ready skills. Networking opportunities with professionals and mentors are abundant in Bangalore's thriving tech ecosystem. Lastly, the competitive job market encourages faster skill development and high-paying roles.
Techniques and Trends in Tableau Software Training in Bangalore
- Hands-On Projects: Real-world datasets and live projects are used to help learners build practical skills.
- Data Storytelling Techniques: Courses focus on how to turn data insights into compelling narratives for stakeholders.
- Integration with AI and ML: Training incorporates how Tableau connects with AI/ML tools for advanced analytics.
- Cloud-Based Learning: Many institutes offer cloud-based environments, enabling remote access to Tableau resources.
- Job-Oriented Modules: Curricula now include interview preparation, resume building, and placement assistance.
The Most Recent Tableau Software Certification in Bangalore Tools
Modern Tableau Software Course in Bangalore tools now include virtual labs, interactive dashboards, and AI-powered feedback systems. Platforms like Tableau Public and Prep Builder offer practical experience. Online simulators replicate real job tasks to improve readiness. Learning management systems track progress and suggest improvements. Tools now support mobile learning, allowing flexibility in practice. These innovations make learning more effective and engaging than ever. Training also focuses on Tableau Public for portfolio building and Tableau Mobile for on-the-go access. These tools ensure learners can handle end-to-end data workflows efficiently.
Career Opportunities After Tableau Software Training
Tableau Developer
Design and develop interactive dashboards and visualizations using Tableau Desktop. Work with business users to understand reporting needs and translate them into Tableau.
Data Analyst
Analyze complex data sets and create insightful visualizations to drive business decisions. Use Tableau to explore data trends, KPIs, and predictive analytics.
Business Intelligence Analyst
Develop business intelligence solutions with Tableau for multiple departments. Focus on improving decision-making through interactive reports and dashboards.
Tableau Consultant
Provide expert advice and implementation services for Tableau deployments. Customize Tableau dashboards and reports based on client requirements.
Data Visualization Specialist
Create compelling visualizations that effectively communicate complex data stories. Apply best practices in design, color theory, and UX within Tableau dashboards.
Tableau Administrator
Manage Tableau Server environment including installation, configuration, and upgrades. Handle user permissions, scheduling, and monitoring server health.
Skill to Master
Tableau Desktop Fundamentals
Data Connection and Preparation
Building Interactive Dashboards
Calculated Fields and Table Calculations
Data Blending and Joins
Parameters and Filters
Storytelling with Data
Tableau Prep for Data Cleaning
Performance Optimization Techniques
Tableau Server Administration
Security and User Management
Integration with R and Python
Tools to Master
Tableau Desktop
Tableau Server
Tableau Online
Tableau Prep Builder
Tableau Public
Tableau Mobile
Microsoft Excel
SQL databases
Cloud data sources
R integration
Python integration
Power BI
Learn from certified professionals who are currently working.

Training by
Ravi, having 12 yrs of experience
Specialized in: Data Visualization, Tableau Desktop & Server, Dashboard Development, and Business Intelligence Strategy.
Note: Ravi is a seasoned data visualization expert with over a decade of experience in business intelligence and analytics. He has led data-driven projects across finance, healthcare, and retail sectors, helping organizations convert complex data into clear, actionable insights. Ravi brings hands-on expertise in Tableau, enabling professionals to master dashboard creation, storytelling with data, and server management for enterprise-level reporting.
Premium Training at Best Price
Affordable, Quality Training for Freshers to Launch IT Careers & Land Top Placements.
What Makes ACTE Training Different?
Feature
ACTE Technologies
Other Institutes
Affordable Fees
Competitive Pricing With Flexible Payment Options.
Higher Fees With Limited Payment Options.
Industry Experts
Well Experienced Trainer From a Relevant Field With Practical Training
Theoretical Class With Limited Practical
Updated Syllabus
Updated and Industry-relevant Course Curriculum With Hands-on Learning.
Outdated Curriculum With Limited Practical Training.
Hands-on projects
Real-world Projects With Live Case Studies and Collaboration With Companies.
Basic Projects With Limited Real-world Application.
Certification
Industry-recognized Certifications With Global Validity.
Basic Certifications With Limited Recognition.
Placement Support
Strong Placement Support With Tie-ups With Top Companies and Mock Interviews.
Basic Placement Support
Industry Partnerships
Strong Ties With Top Tech Companies for Internships and Placements
No Partnerships, Limited Opportunities
Batch Size
Small Batch Sizes for Personalized Attention.
Large Batch Sizes With Limited Individual Focus.
LMS Features
Lifetime Access Course video Materials in LMS, Online Interview Practice, upload resumes in Placement Portal.
No LMS Features or Perks.
Training Support
Dedicated Mentors, 24/7 Doubt Resolution, and Personalized Guidance.
Limited Mentor Support and No After-hours Assistance.
We are proud to have participated in more than 40,000 career transfers globally.

Tableau Software Certification

Yes, Tableau offers several certification paths, including Tableau Desktop Specialist, Tableau Desktop Certified Associate, and Tableau Server Certified Associate.
Yes, Tableau Software Course with Placement guarantees a job, Strengthens your resume, Increases credibility, Enhances your chances of getting shortlisted during recruitment.
Yes, Tableau Software Training with Certification exams are available online, allowing candidates to take them remotely with a proctored environment to maintain exam integrity.
Yes, Investing in Tableau Software Training with Certification is definitely worth as it equips you with in-demand data visualization skills that are highly valued in industries ranging from finance to healthcare. .
Frequently Asked Questions
- You can register for a free demo session on our website
- Contact our support team to schedule a live demo.
- Tableau instructors are typically certified Tableau Desktop Specialists.
- Tableau Software Course with Placement usually have several years of hands-on industry experience in data visualization.
- Yes, we provide dedicated placement assistance, including resume building, interview preparation, and connecting you with hiring partners.
- Absolutely. The Tableau certification you earn is widely recognized by employers globally and adds strong value to your professional profile.
- Yes, our Tableau Software Course with Placement includes multiple hands-on labs and real-world projects to help you gain practical experience with Tableau.